Updated September 29, 2026 · Originally published September 29, 2026
Walk into almost any dispensary and scan the flower jars. 20.4%. 21.1%. 20.2%. 22%. It can start to feel like cannabis just naturally grows at "a little over 20% THC." It doesn't. Plants don't know what a round number is. But when a researcher lined up nearly 200,000 real lab results from two states, he found a sharp cliff right at 20%: far fewer results than expected just below the line, and a pile-up just above it.
So is flower secretly engineered to clear the bar, or is something happening at the lab? The data turns out to have a surprisingly clear answer.
The Quick Version
- There's a spike right at 20%. In Nevada, lab results jumped by about 43% just above the 20% THC line compared with just below it. In Washington, the jump was about 17%.[1]
- It's not the plants. Natural variation should produce a smooth curve with no reason to care about 20%. A jump at a round number points to an economic reason, not a biological one.
- It depends on the lab. Washington's largest lab showed essentially no jump. Two labs that were suspended for testing irregularities showed a 47% jump, and it held even when the same growers sent product to both.[1]
- Bottom line: a flower label depends partly on which lab tested it. If you're infusing, the number that matters is the one you measure in your own material.
Why 20% Is the Number Everyone Wants
There's nothing chemically special about 20% THC. A 19.8% flower and a 20.2% flower are, for all practical purposes, the same product. But on a shelf, they don't sell the same. Higher-THC flower commands higher prices, and 20% has become a kind of unofficial quality badge. Press reports quoted in the study describe the pressure bluntly: in Nevada, "The standard is 20 percent and higher. No one wants a THC level under that," and in Washington, many stores reportedly wouldn't even look at flower testing under 20%.[1]
That creates an incentive chain. Stores pay more for 20%+ flower, so growers want 20%+ results. And in both of these states, growers choose which lab tests their product. If one lab tends to report higher numbers, it's easy to see why it might win more business. The industry even has a name for this: "lab shopping."
How You Catch a Suspicious Spike
Michael Zoorob, a researcher at Harvard, got the testing records from two regulated markets: about 142,800 flower results from Washington (June 2014 to May 2017) and about 55,500 from Nevada (December 2017 to January 2020).[1] He kept THC-dominant flower, used the same "total THC" number that goes on labels, and dropped a small number of results above 35% as biologically implausible.
Then he asked a simple question: are there about as many results just under 20% as just over it?
What the Nevada Data Looks Like
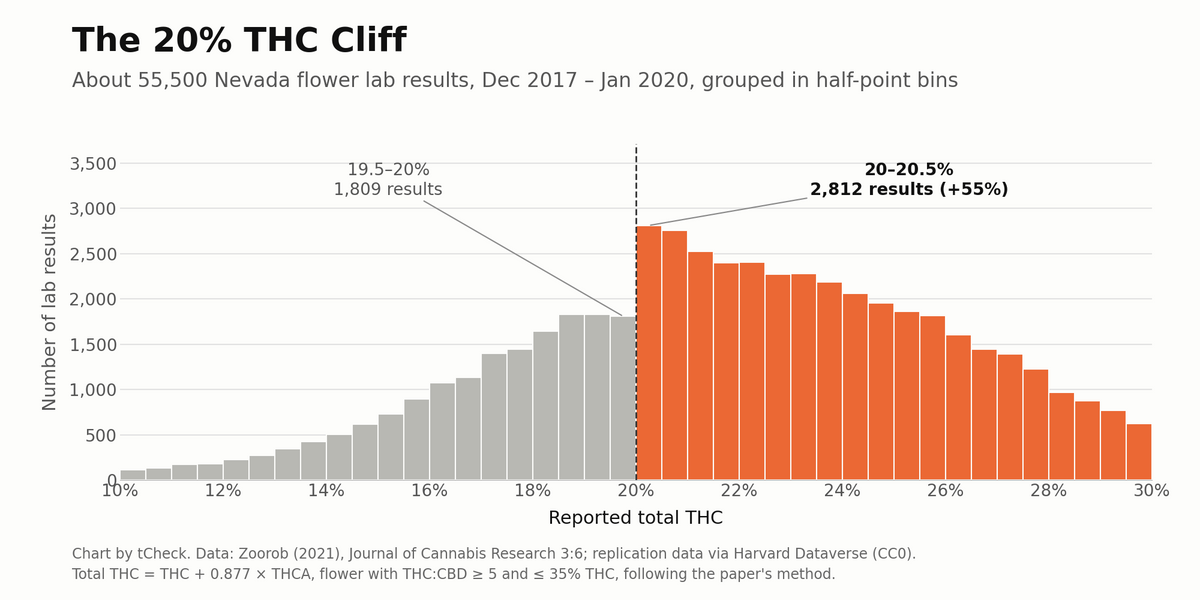
We downloaded the study's public replication data[2] and redrew the Nevada results ourselves. You don't need a statistics degree to spot the problem.

In the half-point just below 20% there are 1,809 results. In the half-point just above it there are 2,812, about 55% more. The study's formal test, which fits the curve on both sides of the line, puts the jump at about 43%, and the odds of that happening by chance are vanishingly small.[1] Washington showed the same pattern, just smaller: a jump of about 17%.
So Who's Moving the Numbers: Growers or Labs?
There are two ways a spike like this could happen. Growers could somehow be steering their plants to just clear 20%, which is hard to do with that kind of precision. Or some labs could be reporting results that land just over the line more often than they should.
Washington's data includes which lab ran each test, which makes this testable. If growers were driving the spike, every lab should see it. They didn't:
- Washington's largest lab (almost 40,000 tests): about a 1% change at 20%. That's statistically the same as no jump at all.
- Two labs that had their licenses suspended for testing irregularities (about 35,000 tests combined): a 47% jump at 20%.[1]
The most convincing check came next. Some growers sent product to both the largest lab and the suspended labs. Looking only at those growers, the largest lab still showed a smooth curve (a 2% change, not statistically meaningful), while the suspended labs showed a 52% jump.[1] Same growers, same general kind of product, very different numbers depending on who ran the test.
Same Growers, Different Labs
We pulled out those shared growers from the public data ourselves (233 of them) and plotted what each lab reported for them.[2]

At the largest lab, 28% of these growers' results came back at 20% or higher, with a median of 17.8%. At the two suspended labs, 80% did, with a median of 22.6%. About 96% of these growers averaged higher THC at the suspended labs than at the largest lab, and the typical gap was more than 4 percentage points. Look at the right-hand chart just below the line: the bars drop off sharply, as if results that should have landed at 19% mostly didn't.
To be fair, this doesn't prove anyone cheated. Growers may not have sent identical strains or batches to each lab, and the study itself describes its findings as statistical evidence "suggestive" of manipulation, not proof of it.[1] But it lines up with earlier research showing that Washington labs differed systematically in the THC they reported, even after accounting for strain, grower, and testing date.[3]
A note on the numbers: the 43%, 17%, 1%, 47%, 2%, and 52% figures come from the paper's statistical tests. The bin counts, shares above 20%, medians, and grower comparison are our own calculations from the same public dataset, using the paper's filters. Our Nevada count comes out one result higher than the paper's (55,524 vs. 55,523), which doesn't change anything.
What This Means for Your Infusions
This data is several years old and comes from two states, and testing oversight has had time to change since then. But the lesson carries over: the THC number on a flower jar isn't just a property of the flower. It also reflects which lab tested it, how that lab works, and what the market rewards. That lines up with what we covered in our look at a recent Colorado study, where flower labels tended to overstate THC and almost half of them missed Colorado's ±15% accuracy window.
For a home infuser, a few points of THC isn't a rounding error. Say you infuse 3.5 grams of flower into oil and portion it into 30 servings:
- If the flower really is 22% THC: about 770 mg of THC on paper, or roughly 26 mg per serving.
- If a different lab would have called it 18%: about 630 mg, or roughly 21 mg per serving.
That's about a 20% swing in every serving, before you even account for decarb and extraction losses, from nothing more than which lab happened to test the batch. It's also why flower-to-oil ratios and dosage calculators can only be as accurate as the THC number you feed them.

The Bottom Line
Cannabis doesn't grow in round numbers, but in these two markets, lab results did. The spike at 20% THC appeared at some labs and not others, even for the same growers, which points to lab-level differences rather than anything about the plants. You can't choose which lab tested the flower you bought. What you can do is measure what you actually have before you infuse, so your recipe starts from your number instead of the label's.
Test the Flower You Actually Have
The tCheck Potency Tester measures THC or CBD in your own flower or infusions in about 2 minutes, so your dosing math starts from your sample, not a label.
Get the tCheck Potency Tester →References
- [1] Zoorob, M. J. (2021). The frequency distribution of reported THC concentrations of legal cannabis flower products increases discontinuously around the 20% THC threshold in Nevada and Washington state. Journal of Cannabis Research, 3, 6. DOI: 10.1186/s42238-021-00064-2 · PubMed Central PMC7958443
- [2] Zoorob, M. J. Replication data for "The frequency distribution of reported THC concentrations…". Harvard Dataverse. DOI: 10.7910/DVN/GNFVBS. Released under CC0 1.0. Charts in this article were created by tCheck from this dataset, using the paper's definitions: total THC = THC + 0.877 × THCA, THC-dominant flower (THC:CBD ratio of 5 or more), results of 35% THC or less.
- [3] Jikomes, N., & Zoorob, M. (2018). The cannabinoid content of legal cannabis in Washington State varies systematically across testing facilities and popular consumer products. Scientific Reports, 8, 4519. DOI: 10.1038/s41598-018-22755-2
A note on sourcing: the figures above come from one peer-reviewed study of state testing records for flower products in Washington (2014–2017) and Nevada (2017–2020). They describe patterns in that data, not the practices of any current lab, and not a guarantee about labeling accuracy in any other state or for any specific product you might buy. The study presents statistical evidence consistent with manipulation; it does not establish wrongdoing by any particular party.

Written by
Peichen Chang
Founder & CEO, tCheck
Peichen spent most of his career designing ASICs (computer chips) for enterprise data storage. One day, a friend asked for help dosing her homemade edibles to control Parkinson’s symptoms, and tCheck was born. When he is not communing with AIs, he is cooking, traveling, or hiking.