Updated April 25, 2026 · Originally published January 6, 2026
🌿 tCheck vs. HPLC: Key Takeaways
- HPLC separates cannabinoids by “stickiness” in a column — CBDa falls off at 3:20, CBD at 4:10, Delta-9 THC at 6:30, THCa at 7:15
- tCheck is the detector, not the separator — it uses UV-Vis spectrometry (the same detector used in HPLC) but lacks the separation column, so it measures total cannabinoid content, not individual compounds
- HPLC costs $35,000–$50,000+ plus expensive chemicals and trained technicians — far beyond most home users
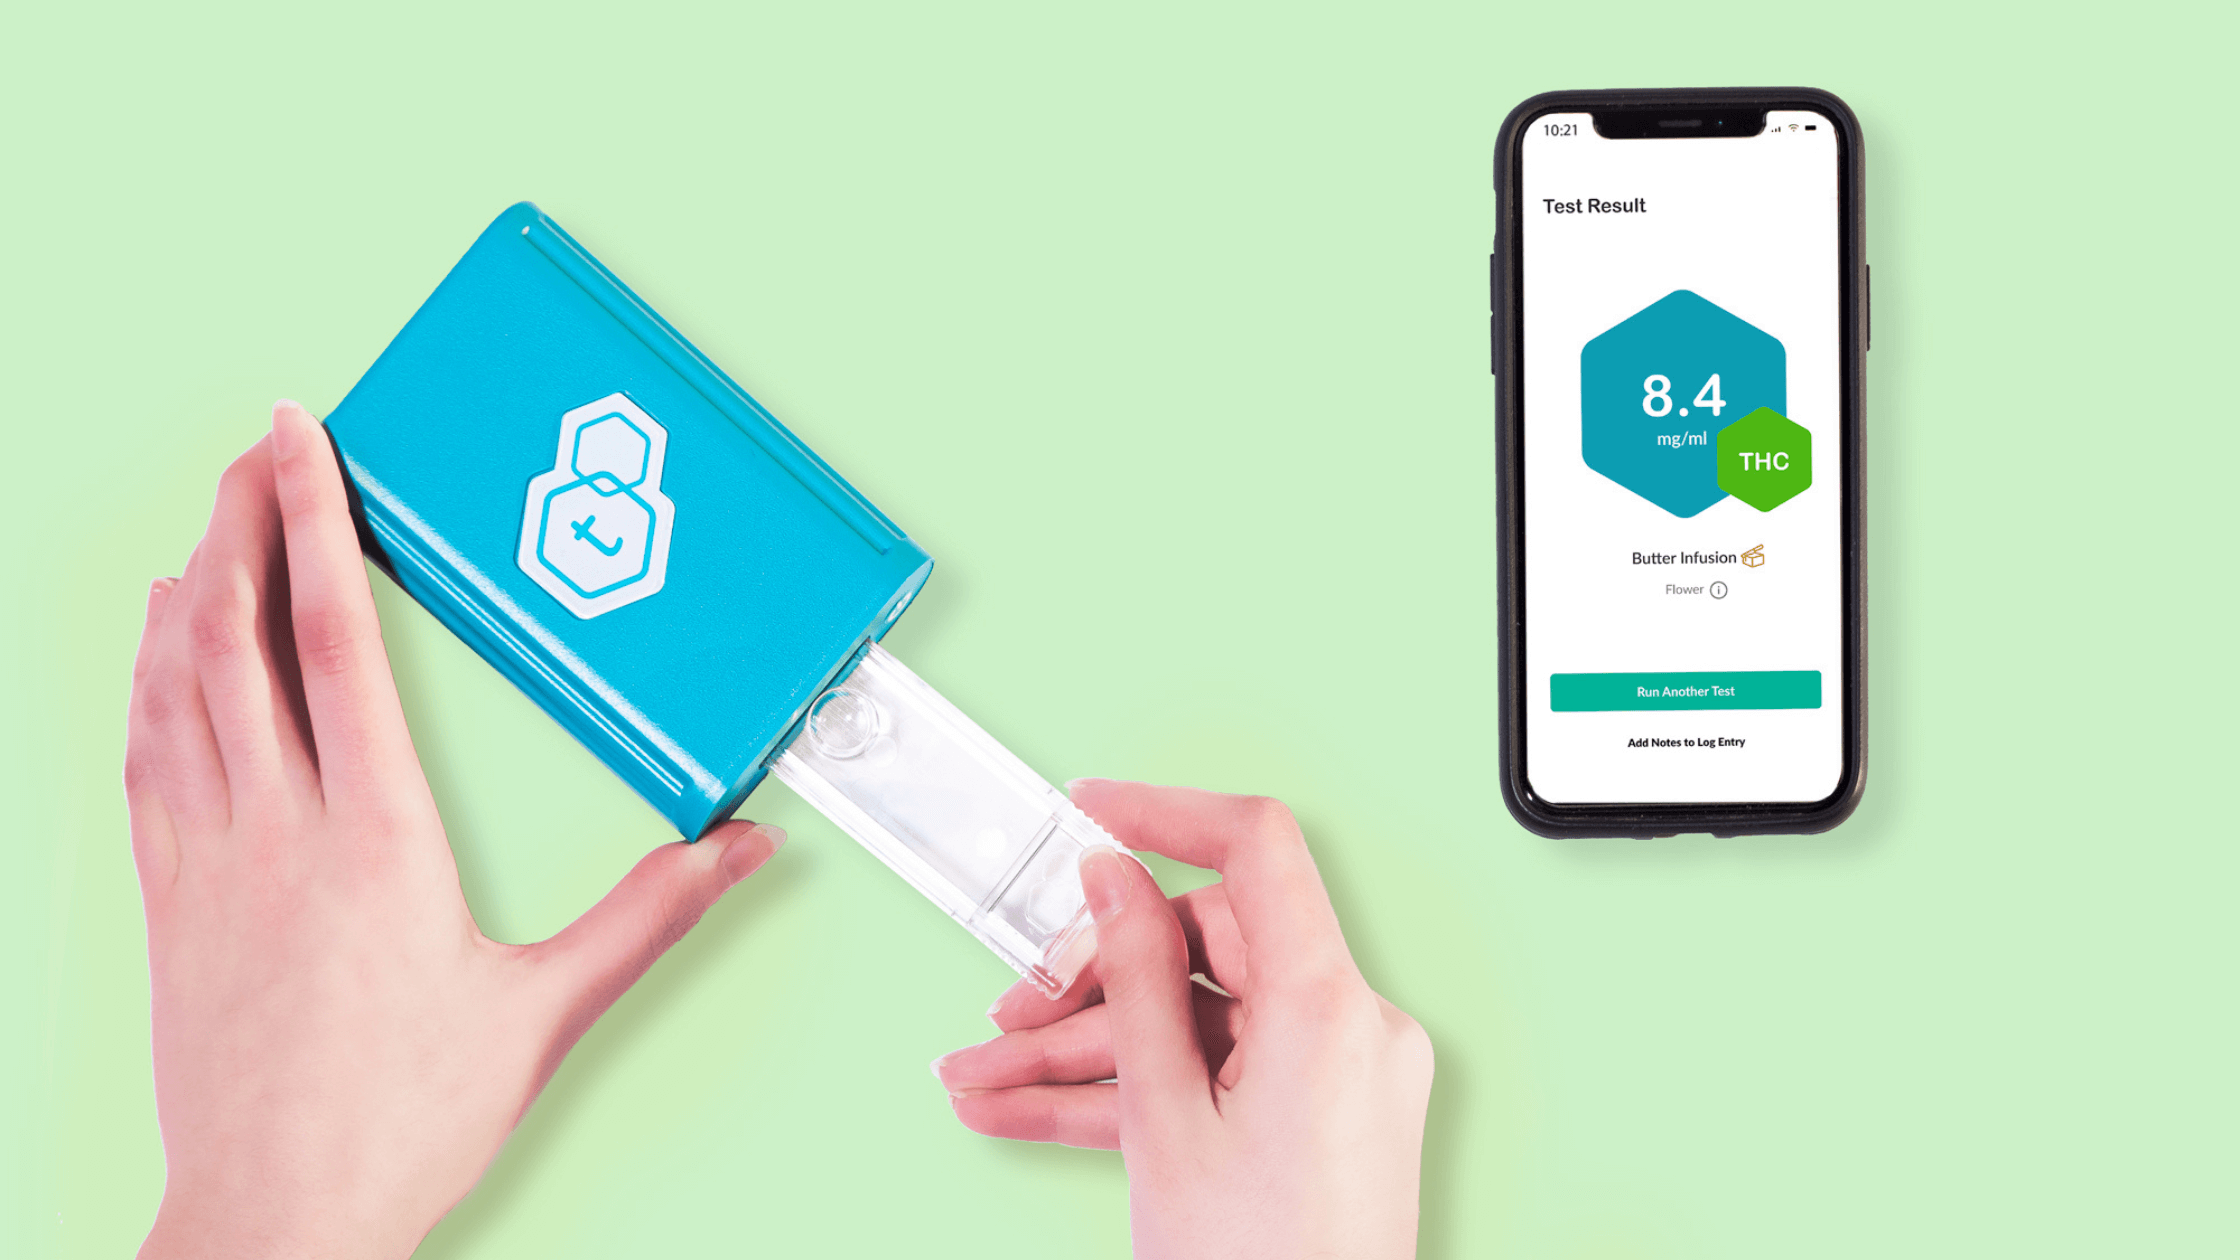
- Test at home precisely: Use a tCheck home potency tester when you know whether your material is THC- or CBD-dominant
In This Article
A common question we get is: “Can tCheck measure THC and CBD separately?” The short answer is unfortunately, no. The next question is: “why not?”
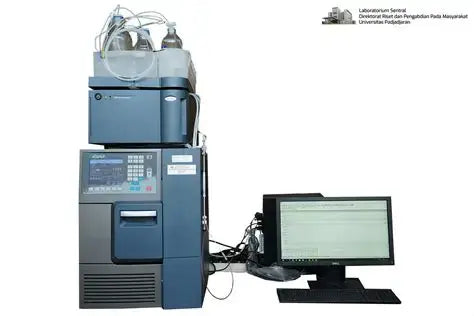
When we created tCheck, we based the underlying technology on a machine called an HPLC — which is the gold standard today for testing cannabinoids. HPLC stands for high pressure (performance) liquid chromatography. Two components are particularly important: the column and the detector.
How HPLC Works: The Merry-Go-Round Analogy
The column in an HPLC is a tube packed with specially coated granules. That coating is designed to be somewhat “sticky.” The detector sits at the end of the column and detects when compounds pass all the way through. The key concept: different cannabinoids (such as THC and CBD) have different levels of stickiness in the column. CBD, for example, is much less sticky than THC.
HPLC Testing Requirements
| Requirement | Details |
|---|---|
| Liquid Samples Only | Solid samples like cookies must be infused or extracted into a liquid solvent before testing |
| Beer-Lambert Limitation | Maximum accuracy range (linearity) — samples may need dilution to fall within measurable range |
Before running the HPLC, the operator must convert the sample to a liquid — typically by soaking it in a solvent such as acetonitrile or methanol. This liquified sample is then filtered and injected into the HPLC column (the “stationary phase”).
Using a series of pumps, the HPLC flows another solvent (the “mobile phase”) through the tube. Cannabinoids with high stickiness cling to the column granules longer; less sticky compounds let go sooner.
Think of it like a playground merry-go-round from the 70s and 80s. Everyone piles on, then it spins faster and faster. Smaller kids — with weaker grip strength — get flung off first. Older, stronger kids hold on longer. Eventually almost everyone flies off. The HPLC works the same way: different cannabinoids “hang on” for different amounts of time, and a detector at the end measures when each one lets go.
HPLC Cannabinoid Retention Times
The detector at the end of the column records exactly when each cannabinoid is “flung off,” measured in minutes and seconds from the start of the run:
| Cannabinoid | Retention Time | Stickiness Level |
|---|---|---|
| CBDa | 3:20 | Least sticky — falls off first |
| CBD | 4:10 | Low-medium stickiness |
| Delta-9 THC | 6:30 | High stickiness |
| THCa | 7:15 | Highest stickiness — falls off last |

The detector itself is a UV-Vis spectrometer — the darker the signal, the more of a compound is present. By combining the time a compound exits the column with the intensity of the detector signal, HPLC precisely measures the quantity of each cannabinoid. Back to the merry-go-round: imagine there are only three types of kids — toddlers, tweens, and teens. All toddlers fly off first; by measuring their combined weight, you know how many there were. Tweens next, then teens.
An HPLC typically costs $35,000–$50,000, plus expensive chemicals for running and calibration, and a trained technician to operate it. This is obviously beyond the reach of most consumers, home growers, and small manufacturers.
Where tCheck Fits In
tCheck is the detector portion of an HPLC — specifically, the UV-Vis spectrometer. In the chromatogram graph above, this corresponds to the height of each peak. But tCheck does not include the separation column. Without the column, there’s no mechanism to distinguish one cannabinoid from another.
Home Testing with tCheck
tCheck solves this limitation by assuming that most consumers already know whether their material is THC- or CBD-dominant, and whether they’ve properly decarboxylated (activated) it. In merry-go-round terms: if you know the merry-go-round only has tweens on it, you just need to measure the total weight of whoever flies off. That’s what tCheck does — it measures total cannabinoid content accurately and affordably, without the lab overhead.
Want to understand more about cannabis potency testing methods? Or learn how to test cannabis edibles at home? Ready to start measuring? Get started with affordable at-home cannabis potency testing with tCheck →
Frequently Asked Questions
Can tCheck tell me how much THC vs. CBD is in my product?
No — tCheck measures total cannabinoid content but cannot distinguish between individual cannabinoids like THC and CBD. That separation requires a column chromatography step (the “merry-go-round” in HPLC) that tCheck does not have. To get accurate results, you need to know in advance whether your material is THC-dominant or CBD-dominant and test each sample type separately.
Why does HPLC cost so much compared to tCheck?
A full HPLC system costs $35,000–$50,000 for the machine alone, plus ongoing costs for solvents, calibration standards, and a trained technician. tCheck achieves affordable at-home testing by using just the UV-Vis detection component of HPLC and simplifying the workflow by assuming you know your sample type. This tradeoff makes tCheck practical for consumers, home growers, and small manufacturers who would otherwise have no way to test potency.
What does tCheck actually measure?
tCheck uses UV-Vis spectrometry to measure the total concentration of the dominant cannabinoid in your sample — either THC (in THC-dominant infusions, flowers, or tinctures) or CBD (in CBD-dominant products). It does not separate or identify individual cannabinoids; it measures the total optical density of the sample and converts that to a potency reading based on the sample type you select. For a deeper dive, see our article on how accurate tCheck is.


